Characteristics of Maxima and Minima
The essential characteristics of maxima and minima of a function may be outlined as under:
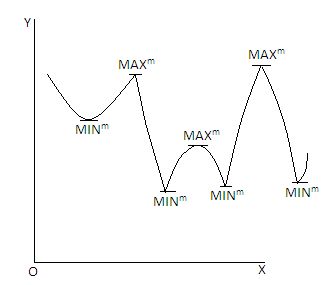
(i) The maximum and minimum values of a function at a point are in relation to the immediate neighbourhood of that point. They do not mean the greatest and the smallest values of the function as a whole. The minimum values at a point may be greater than the maximum value at another point. For example, in the above graph, it may be noticed that the minimum value of the function at the point C1 is greater than the maximum value of the function at the point C4.
(ii) There may be several points of maximum and minimum is a function graphed as under :
(iii) The maxima and minima of a function always occur alternatively.
(iv) The points of maxima usually look like mountain tops and the points of minima like the valley bottoms.
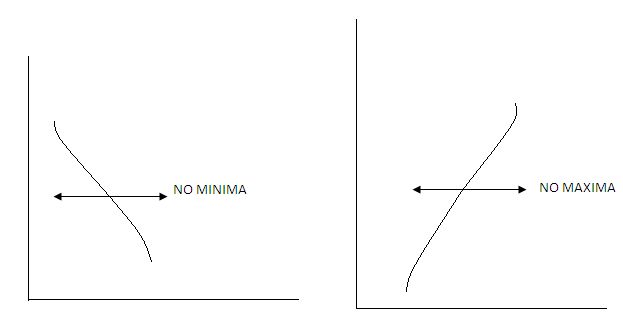
(v) There may not be any point of maxima, or minima in a function graphed as under.
From the Fig. 3 above, it must be observed that in both the sides of the bending point O, the curve moves upward. Therefore, at all the points to the left and right of the bending point, the values of the first derivative dy/dx must be positive. This point O is called the point of inflexion since, there is a bend of the curve at this point, where dy/dx = 0. At this point d²y/dx², is also equal to zero as this gives neither maximum, nor minimum point.
(vi) At a point of maxima, the function ceases to increase and begins to decrease, and the value at this point is higher than any value on either side of it. This can be seen from the following graph.
From the above graph, it must be seen that the value of y increases up to the point C1 with the increase in X up to the point Q1, and after that it begins to decrease. As the value of X increases from Q1 to Q2, the slope of the curve changes from zero to negative quantity, or that the slope decreases as X increases.
Thus, at a point of maximum dy/dx = 0, and d²y/dx² < 0
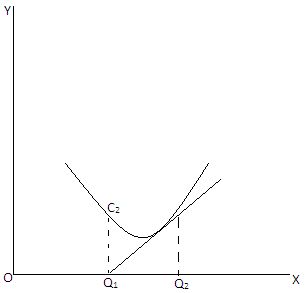
(vii) At a point of minima, the function ceases to decrease, and begins to increase, and the value of the function at this point is lower than any value of either side of it. This can be seen from the following graph.
From the above graph, it must be seen that the value of y decreases up to the point C2 with the increase in X up to the point Q1, and after that it begins to increase. As the value of X increase from Q1 to Q2, the slope of the curve changes from zero to positive, or that the slope increases as X increases. Thus, at a point of minima.
= dy/dx = 0 and d²y/dx² > 0
(viii) The point at which a function has maximum and minimum values are called turning points where dy/dx = 0, since it is a continuous function of x which can change its sign from a positive to negative, or vice versa only by passing through a zero value. But at this point d²y/dx² ≠ 0. If, at a point d²y/dx² = 0, the same is called a point of inflexion where, the function does not changes its sing. This can be verified from the graph under Fig. 3 and Fig. 4 drawn above.
The values at points of maxima and minima are called turning values or the extreme values.


