Total Utility and Marginal Utility
To understand different laws of consumption, we ought to know two different concepts of utility, i.e. total utility and marginal utility.
Total utility is the sum of all the utilities derived from the consumption (or possession) of all units of a commodity. For example, if a person has five kilograms of apple, the total utility of five kilograms of apple is the sum of utilities of all the five kilograms. Thus if we add utility of that quantity of a good, we can derive total utility of that quantity of good.
The utility derived from and additional unit of a good is called marginal utility. In other words, addition made to the total utility by consuming (or possessing) one more unit of a good is called marginal utility. For example if the total utility of five oranges of the sixth orange is 32-30=2. This is the addition made to the total utility by consuming (or possessing) and additional unit of orange (6th orange). In symbolic terms:
MUn = TUn-1
Where Mu and TU stand for marginal utility and total utility respectively and ‘n’ stands for any real number.
The relation between marginal utility and total utility can he best understood from the following example as tabulated below.
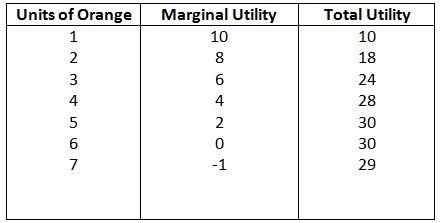
If we analyse the above table, we can mark the following relationship between marginal utility and total utility.
- As stock of a commodity (orange) increases, the marginal utility diminishes but total utility increases at a diminishing rate.
- When the marginal utility is zero, total utility becomes maximum.
- When marginal utility is negative, total utility starts declining.
The relationship between marginal utility and total utility is graphically represented in the following diagram.
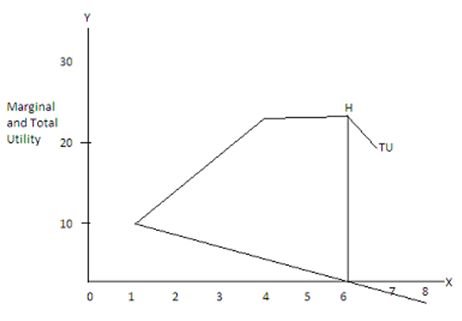
In the above diagram, as the stock of oranges increases in X-axis , the marginal utility (MU) curve slopes downwards o right and the total utility (TU) curve touches the X-axis indicating zero marginal utility and the TU curve reaches the highest point H. When the seventh apple is consumed, the MU curve crosses the X-axis indicating negative utility the TU curve slopes downwards.
