Format of a Graph
The format of an ordinary graph can be shown as under:
The above format of a graph is explained as under:
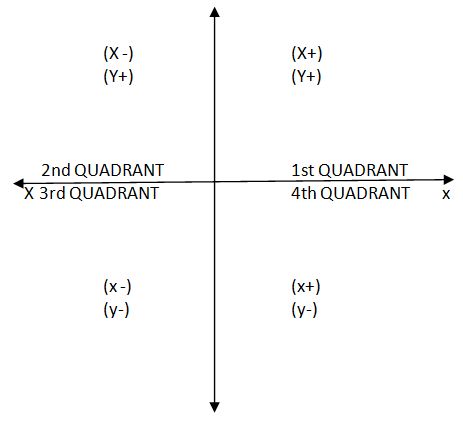
(i) A graph paper is taken on which two lines representing two variables, say X and Y are first drawn cutting each other at right angle.
(ii) The horizontal line is called abscissa which is marked as – X axis to represent the X variable, and the vertical line is called ordinate which is remarked as – Y axis to represent the Y variable. The central point at which the two lines intersect (cut each other) is called point of origin. Which is marked as 0 (zero)
(iii) The four divisional parts thus obtained in the total area of the graph are called quadrants which are marked anti-clock wise at 1st, 2nd , 3rd and 4th quadrant respectively shown as above.
(iv) The 1st quadrant, L is used to represent the positive values of both X and Y variable. Most of the graphs representing the time series etc. are drawn in this form. The 2nd quadrant is used to represent the negative values of X and positive values of Y variable. The 3rd quadrant, is used to represent the negative values of both X and Y variable. The 4th quadrant is used to represent the positive values of X and negative values of Y variable.
(v) Both the horizontal and vertical lines are divided into certain equal parts as shown above to represent the different magnitudes of the two variables. The magnitudes of such parts on the two lines may, or may not be equal. Thus, the vertical lien may be divided into certain centimeters while the horizontal lien may be divided into certain inches. The manner of sub-divisions of the two lines will depend upon the size of the maximum values of the two variables to be represented.
(vi) Dots are plotted at each point of co-ordination of the two variables with reference to their pairs of the values as shown in the 1st quadrant of the figure above.
(vii) All the dots are the jointed with each by a line which is extended to the point of origin. This line as shown in the 1st quadrant above is the ultimate graphs which indicates the trend of relation between the two variables X and Y.
