Graphs on Ratio Scale
Graph in which the Y-axis only is divided on a ratio scale is called a graph on ratio scale. In such a graph, the X-axis is divided on a natural scale as usual.
As has been pointed out earlier in this chapter, in a natural scale, equal distance represents equal value, but in a ratio scale equal distance represents equal rate or ratio of changes as depicted in the following figures:
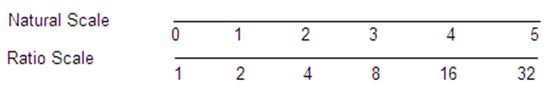
From the above figures, it must be seen that a natural scale measures the absolute changes, where as a ratio measures the relative changes in the values of a variable.
Essential Features of a Ratio Scale
- It never begins with zero but with the minimum value of a variable or with a value little less than the minimum value.
- It never any false base to avoid the unnecessary gap as all the values between zero and the smallest value of the variable are automatically ignored by starting the scale with the minimum value.
- In it, equal distance represents equal proportionate changes in values. Thus, the difference between 10 and 20, 40 and 80, 160 and 320 are measured by the same distance of 1 centimeter as there is the same rate of changes between each of them i.e. 20 is two times of 10,80 is two times of 40, and 320 is two times of 160.
- It can never represent zero, or negative values like that of a natural scale.
- It suitably represents those data in which range is very high.
- It cannot measure absolute changes in the values of a variable
- It cannot study both the aggregate, and the component parts of a data like a natural scale.
- It can accommodate two, or more series of different units on the same graph paper.
- It can accommodate two, or more scales on the same graph paper.
- It can represent the data on a natural scale by converting the data into their logarithms.
