One Dimensional Diagram
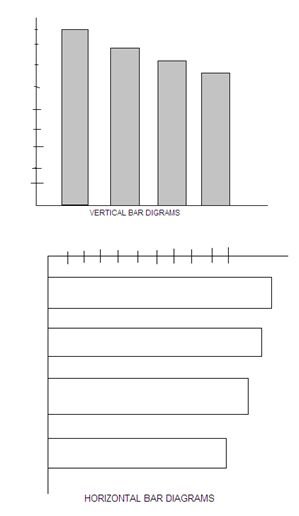
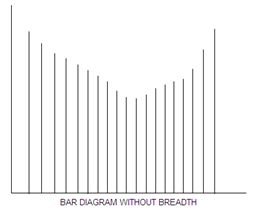
A diagram in which the size of only one dimension i.e. length is fixed in proportion to the value of the data is called one dimensional diagram. Such diagrams are also popularly called bar diagrams. These diagrams can be drawn in both vertical and horizontal manner. The related different bar diagrams differ from each other only in respect of their length dimension, while they remain the same in respect of their other two dimensions i.e. breadth and thickness. The size of breadth of each of such diagrams is determined taking into consideration the number of diagrams to be drawn, and the size of the paper at one’s end. They may take the form of a line, or a thread if they are to be drawn in large numbers on the surface of a paper. However, their breadth should neither be too large nor too small for that in both the cases they look ugly. The dimension of thickness does not look prominent in such diagrams. The examples of such diagrams are given on the next page.
Techniques of drawing bar diagrams
The following are the techniques of drawing the bar diagrams :
(i) First, draw the base line, preferably horizontally, and divide it into a number of equal parts keeping in view the number of diagrams to be drawn.
(ii) Then, draw the scale line preferably vertically, and divide into a number of equal parts keeping in view the maximum value to be represented.
(iii) Then, fix the width of the bar uniformly keeping in view the number of bars to be drawn and the gaps to be provided in between each two of them.
(iv) Then, fix the size of gaps to be provided between each of the two bars uniformly.
(v) Then, fix the lengths of the different bars in proportion of the value of the data.
(vi) Then, draw the different bars in accordance with their length, and width thus fixed, and arranged in order o their length, or time of occurrence.
(vii) Then, decorate the bars with similar or different colours, or shades according to the similarly or dissimilarity in the nature of the data respectively.
(viii) Give a description of the data in short at the bottom of respective bars.
(vix) Put the respective figures at the top of each bar to read out the exact value at a glance without looking at the scale.
Advantages
The chief advantages of a bar diagram can be outlined as under:
- It is very simple to draw and read as well.
- It is the only form of diagram which can represent a large number of data on a piece of paper.
- It can be drawn both vertically and horizontally.
- It gives a better look and facilitates comparison.
Disadvantages
- It cannot exhibit a large number of aspects of the data.
- The which of the bars are fixed arbitrarily by a drawer.
