Simple Bar Diagram
As the name suggests, a simple bar diagram takes the form of a simple bar which is drawn to represent a single data as a whole without further classification of the various characteristics of the said data. The length of such a diagram is fixed in proportion to the magnitude of the data while the width is fixed arbitrarily keeping in view the number of diagrams to be accommodated on the given piece of paper. Such a diagram can be drawn for giving a better look and facilitating comparison. When the number of data to be represented is very large, then bars take the form of simple lines. This diagram is suitable for all types of uni-characteristics not withstanding their number and magnitude. However, this diagram is not suitable for those data which need to be displayed with their multifarious characteristics, or components. However, the technique of drawing such diagrams remains the same as discussed for a bar diagram.
Illustration:
Represent the following data relating to monthly expenditure of the Lenox Hill Hospital.
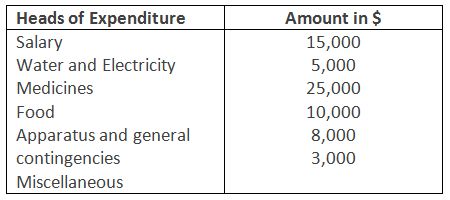
Solution: Diagrammatic representation of data relating to monthly Expenditure of the Lenox Hill Hospital