Chi Square Test
Chi Square Test
An important application of chi-square involves using sample data to test for independence of two variables. Let us explain the concept by an example.
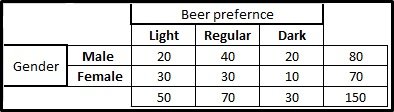
In an analysis of the market segments for the three bears: light, regular and dark, the firm’s market research group raised the question of whether preferences for the three beers differ among male and female beer drinkers.
They will market their product accordingly. Do the men’s drinking preferences differ significantly from the women’s preferences? Use a 0.05 level of significance.
Sample results for beer preferences of male and female beer drinkers (observed frequencies)
Step 1:State the hypotheses.State the null hypothesis and an alternative hypothesis.
H0: Gender and drinking preferences are independent.
H1: Gender and drinking preferences are not independent.
Step 2:Analyse sample data.Degree of freedom and expected frequency is calculated.
DF = (r – 1) * (c – 1) = (2 – 1) * (3 – 1) = 2
Er,c = (nr * nc) / n
E1,1 = (80 * 50) / 150 = 26.66
E1,2 = (80 * 70) / 150 = 37.33
E1,3 = (80 * 30) / 150 = 16.00
E2,1 = (70 * 50) / 150 = 23.33
E2,2 = (70 * 70) / 150 = 32.67
E2,3 = (70 * 30) / 150 = 14.00
Χ2 = Σ [ (Or,c – Er,c)2 / Er,c ]
Χ2 = (20 – 26.66)2/26.66 + (40 – 37.33)2/37.33 + (20 – 16)2/16
+ (30 – 23.33)2/23.33 + (30 – 32.67)2/32.67 + (10 – 14)2/14
Χ2 = 1.67 + 0.19 + 1.00 + 1.90 + 0.22 + 1.14 = 6.12
We use the Chi-Square Distribution value at 5% significance level = 5.991
Step 4: Interpret results. Since the chi-value (5.991) is less than the calculated value of 6.12, we cannot accept the null hypothesis. Thus, we conclude that there is a relationship between gender and drinking preference
