Free Hand Graphic Method
Under this method, the values of a time series are plotted on a graph paper in the form of a historigram. For this, the time variable is shown on the horizontal axis, the value variable on the vertical axis, and the dots are plotted on the graph paper at the intersecting points of the time and value variables. After this, a curve is drawn with free hand through the plotted dots in such a manner that it represents the general tendency of the time series, and eliminates all its other components viz: seasonal, cyclical and irregular ones.
Illustration 1.
From the following data, fit a free hand smooth curve and forecast the trend values thereby.

Solution
Graphic representation of the trend line relating to the production of Peddy by the method of free hand curve.
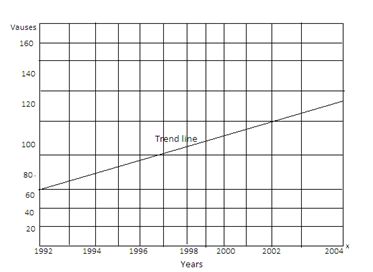
(b) Forecasting of the trend values by location on the trend line.
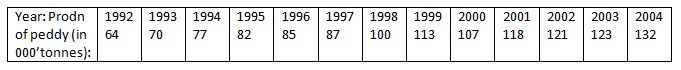
From the above, it may be observed that there is a gradual rise in the trend values as against zig zag yearly values.
The trend line thus drawn above can be extended to forecast the values for any future year. But this method being purely of subjective nature, cannot always give dependable results.
(ii) Arbitrary Average Method
Under this method, the values of any two points of time preferably, those of the extreme ones, or any other close to them are arbitrarily selected as the average of trend in the series. Basing upon these two averages, a trend line drawn on a graph paper in a free hand smoothed manner to show the general tendency of the data. Referring to such a trend line, the trend values of the different times are determine d by location. Alternatively, the trend values of the different times are computed by adjusting the average change in value of the preceding point of time is represented by 1, and that of the succeeding point of time by , and the time gap between the two points of time by N. The average change in the values between the two selected points of time is computed by
![]()
This average change in value is multiplied by the time gap ‘t’ between the selected point of time and the observed time and the resultant figure is subtracted from the observed value of the preceding times and added to the observed values of the succeeding times to find out their respective trend values.
Illustration 2.
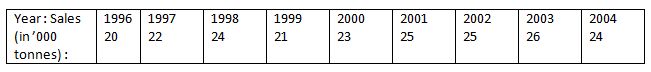
From the following data, fit a trend line, and obtain the trend values for the different years using the arbitrary average method:
Solution:
(a) Selecting arbitrarily the sales of 1997, and 2003 as the average points and we obtain the trend line as follows:
Graphic representation of the Trend Line by the arbitrary average method.

(a) Computation of the trend values
(i) Locating on the above trend line we obtain the trend values for the different years as follows:
(ii) Alternatively
Taking the average change in the annual values we obtain the trend values for the different years as follows:
Average change or
![]()
= (26-22)/6 = 0.67
Adding this average change (.67) to the value of X1 (22) successively for all the years succeeding 1996 and subtracting this average change (.67) from the value of (22) successively for all the years preceding 1996 we obtain the trend values as under:

(iii) Semi-average Method
Under this method, the trend line is fitted to a time series basing upon the average values (usually arithmetic mean) of its two haves called semi-averages. For this, the entire series is divided into two halves, leaving aside there value of the middle period, if there are odd number of periods in the series. The average value of the first half portion of the series is represented by X1 and that of the second half portion by X2 . These two averages are placed against the mid-point these two semi averages X1 and X2 , in a straight linear manner. The trend values for the different times are determined by locating the points on this line. The trend line thus drawn can also be extended both the ways to estimate the trend values for any earlier and later period.
Alternatively, the trend values for the different years can also be obtained by adjusting the average change between the two semi averages ( i.e X2 =x2-x1/N) to any of the semi average value in accordance with the times of deviations from the time of any of the semi averages. Hence, the trend value for any year is computed by
![]()
Where, T = trend value to be computed for any year
X1 = Semi average of the first half of the series.
X2 = Semi average of the second half of the series.
N = time difference between and
And x = Time deviation from X1 and X2 as the case may be.
