Graphic Method of Simple Regression
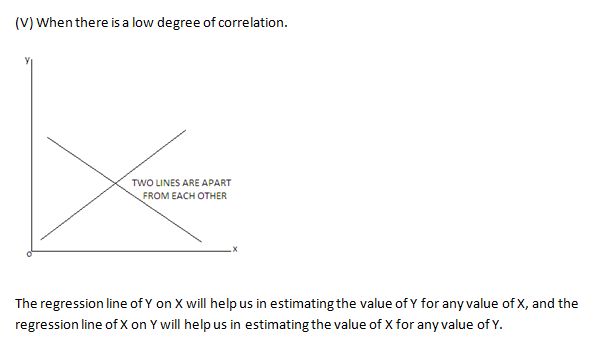
Under this method, one or two regression lines are drawn on a graph paper to estimate the values of one variable say, X on the basis of the given values of another variable say, Y.
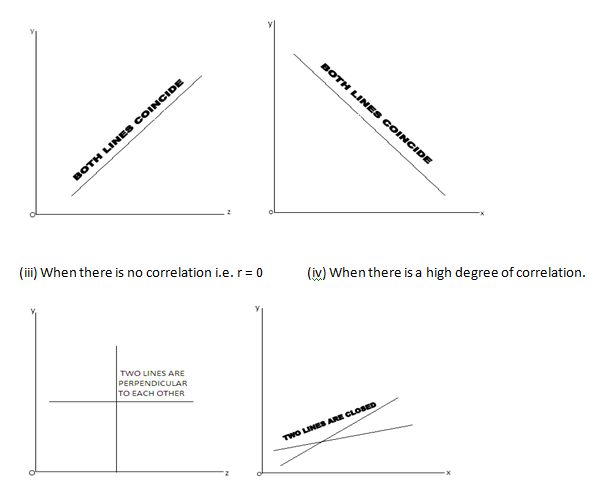
If there is a perfect correlation (i.e. r =1) between the two variables, only one regression line can be drawn, for in that case both the regression lines of X on Y, and Y on X will coincide. In case, the correlation between the two variables is not perfect, two lines of regression are to be drawn on the graph paper one of which will be the regression line of X on Y, and the other will be the regression line of Y on X. If there is no correlation between the two variables, then the two line of regression will be perpendicular to each other. The different forms of the regression line undr different state of correlation are exhibited hare as under:
(i) When there is perfect positive correlation. i.e. r = 1
(ii) When there is perfect negative correlation. 1 i.e. r = -1