Lorenz Curve
- For studying the dispersion of a series graphically, we are to draw a graph of Lorenz curves devised by the famous Economist Max. O. Lorenz of England. This curve was used for the first time for measuring the distribution of wealth, and income. The following steps are to be taken up in turn drawing such curves: The following steps are to be taken up in turn for drawing such curves:
- Cumulate both the values and their corresponding frequencies.
- Find the percentages of each of the cumulated figures taking the grand total of each corresponding column as 100.
- Represent the percentages of the cumulative frequencies on X-axis and those of the values on the Y-axis.
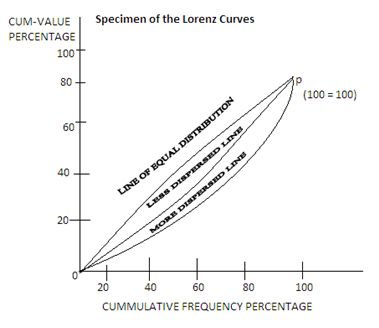
- Draw a diagonal line designated as the “Line of equal distribution joining the point O (0, 0) with the point P (100 100) at an angle of 450 on the Y-axis.
- Plot the percentages of the cumulated values against the percentages of the cumulated frequencies of a given distribution, and join the points so plotted through a free-hand curve. The greater the distance of this curve from the “line of equal distribution”, the greater is the variability of the distribution.
A specimen of the Lorenz curve described above is presented here as under: