STEM and LEAF Plots
STEM and LEAF Plots
The technique used to show both the rank order and the shape of a data set simultaneously.
To illustrate the use of stem and leaf display consider the data in given table
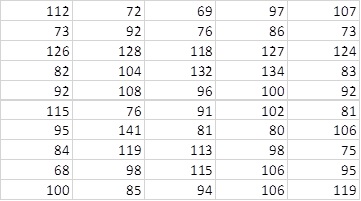
To develop stem and leaf display, first arrange the leading digits of each data value to the left of vertical line. To the right of vertical line, record the last digit for each data value
6 | 9 8
7 | 2 3 6 3 6 5
8 | 6 2 3 1 1 0 4 5
9 | 7 2 2 6 2 1 5 8 8 5 4
10 | 7 4 8 0 2 6 6 0 6
11 | 2 8 5 9 3 5 9
12 | 6 8 7 4
13 | 2 4
14 | 1
With this organization of the data ,sorting the digits on each line into rank order is simple. Doing so provide the stem-and-leaf display shown below.
6 | 8 9
7 | 2 3 3 5 6 6
8 | 0 1 1 2 3 4 5 6
9 | 1 2 2 2 4 5 5 67 8 8
10 | 0 0 24 6 6 6 7 8
11 | 2 35 58 9 9
12 | 4 6 7 8
13 | 2 4
14 | 1
The numbers to the left of the vertical line (6,7,8,9,10,11,12,13 and 14) form the stem, and each digit to the right of vertical line is a leaf .Rotating the page counter clockwise onto its sides provides a picture of the data that is similar to a histogram with classes of 60-69,70-79,80-89,and so on.
